Console Makers Brag About "Attach Rate," the Games Bought per Console. Here Is How the Number Is Built and Bent.
Attach rate is a division, not a measurement — Nintendo publishes both halves of it every quarter, Sony publishes its software as a two-console lump, and the bends live in what each company counts.
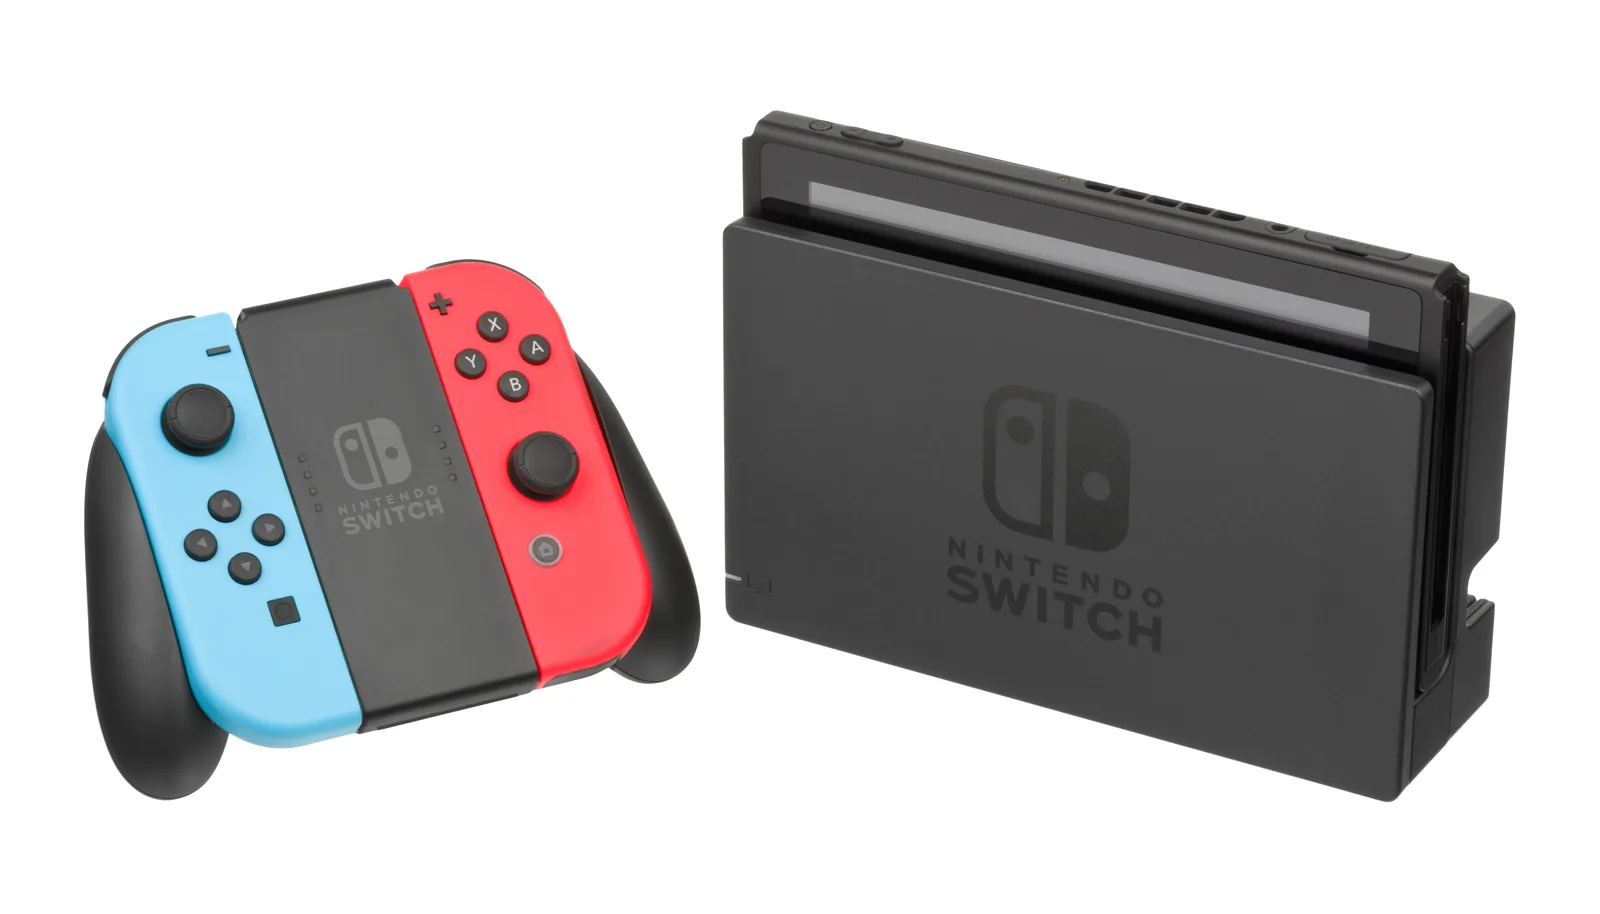
Confirmed, from the companies' own filings: attach rate isn't a number Nintendo or Sony hands you — it's a division you run on their published units, and the two companies publish different halves of the equation. Nintendo gives you both numbers, clean, every quarter. Sony gives you a software total that covers two consoles at once. Watch what that difference does to the bragging.
The Formula Fits in One Line
You're at the controls, so run it yourself. Per-title attach rate: take one game's copies, divide by consoles sold, same date, same company page. "Mario Kart World" at June 30, 2026: 15.39 million copies ÷ 23.68 million Nintendo Switch 2 consoles = 65.0 percent of consoles with that game attached, on Nintendo's own unit figures.
The platform version has its own name — tie ratio — and it's the same division with a bigger numerator: all software units ÷ all hardware units. That's the games-per-console number behind the bragging. Neither company publishes the ratio itself. Nintendo and Sony publish units; the percentage is always somebody's arithmetic, and honest arithmetic shows its working.
Nintendo's Case Builds Clean — and Still Bends
Nintendo's IR pages publish life-to-date units for hardware and software side by side, so the division runs without guesswork. At June 30, 2026, on Nintendo's figures: the original Switch stood at 156.59 million consoles and 1,561.95 million games — a tie ratio of 9.97 games per console. Switch 2, one year into its life, stood at 23.68 million consoles and 58.17 million games — 2.46 per console.
Your couch translation: the older machine's owners have had nine years of birthdays, holidays and backlog sales to stack games beside it, and the new machine's owners have had one. The division doesn't know that. It just divides, and the 9.97 looks four times healthier than the 2.46 for reasons that are mostly calendar.
The per-title version bends faster. "Mario Kart World" launched with the hardware on June 5, 2025, and Nintendo sold it inside a console bundle. Its attach reading at the end of that first quarter: 5.63 million copies ÷ 5.82 million consoles = 96.7 percent. A year later the game had nearly tripled its copies, to 15.39 million — and its attach rate had fallen to 65.0 percent, because the console base had grown to 23.68 million faster than the game had. A falling attach rate, there, is what a healthy launch looks like once the denominator wakes up.
Four Bends, All of Them in the Fine Print
- Bundled copies count. Nintendo's software units include copies bundled with hardware — its fiscal-year material states the point twice over: bundled software sits inside the software unit count, while the revenue from that bundled software is classified as hardware sales. A bundle-heavy launch title starts its attach life with a tailwind no review score gave it.
- Age inflates the platform number. Tie ratio only grows. A console's games-per-console figure in year nine and the same figure in year one aren't two scores in one contest; they're two snapshots of one accumulating pile.
- Editions get counted where the company says. For Nintendo Switch 2 Edition titles, only the packaged version counts toward Switch 2 software, per Nintendo's own footnote; downloads of those editions count under the original Switch. Two honest counters, reading two different footnotes, land on two different ratios.
- Sell-in isn't a living room. Nintendo defines sell-in as sales by the Nintendo group to outside entities — retailers and distributors, plus direct sales to consumers through its own stores and downloads. The denominator counts consoles shipped into the channel, not consoles confirmed under televisions. Sony's hardware figures run on the same sell-in basis, per Sony's disclosures.
None of these bends needs a villain. Each one's a defensible counting choice, disclosed in the company's own material. The bend happens when the ratio travels without its footnotes — when a percentage built on bundled copies and shipped consoles gets quoted as the share of players who chose a game.
Sony's Case Doesn't Build — and That's the Finding
Try the same division on Sony's numbers and you'll hit the wall in one step. Sony doesn't publish cumulative per-title sales for PlayStation 5 games, per its earnings disclosures, so no per-title PS5 attach rate can be built from Sony's own figures at all. Any PS5 attach percentage you've seen for a single game is a third-party estimate wearing a company figure's coat.
The platform version breaks differently. Sony publishes PS5 hardware on its own — 1.6 million units in April–June 2026, with cumulative sell-in passing 95 million by June 30, 2026, per Sony. But Sony's software units don't split by console: its quarterly figure covers PlayStation 4 and PlayStation 5 software combined — 66.1 million full-game units in April–June 2026, 82 percent of them digital downloads, per Sony. Divide a two-console numerator by a one-console denominator and you'll produce a number. It won't mean anything, and it'll still get quoted.
So the honest console-race frame, on the companies' own paper, is asymmetric: Nintendo's attach rates are real divisions of published units, bends and all; Sony's are mostly unavailable, and the unavailable part is the story. One dry note for the road: the company that publishes less gets the cleaner headlines, because nobody can divide its numbers badly in public.
Your Weekend Test for Any Attach Claim
You don't need a spreadsheet. You need three questions, asked in the claimant's own thread:
- Whose numbers, and as of when? A ratio needs its two inputs from the same company on the same date. Mixed dates are mixed drinks.
- Bundled copies in or out? If a launch game's figure doesn't say, assume the bundle's inside it — Nintendo's are, on Nintendo's own statement.
- One console or two? If the software line covers a previous console too — Sony's does — the division's already bent past reading.
A claim that answers all three is a statistic. A claim that answers none is an advertisement, and you can price your weekend accordingly: play the game if it looks good, and let the percentage sell consoles to somebody else. When a launch week throws player counts at you instead of copies, our explainer on how speedrun records get verified teaches the same habit from the other side — a number means something once you know who counted it — and our breakdown of Steam's review labels shows a platform that, to its credit, prints its thresholds where you can check them.
Sources
- Nintendo Co., Ltd., IR — Dedicated Video Game Sales Units and Top Selling Title Sales Units, life-to-date at June 30, 2026 — Switch hardware 156.59 million / software 1,561.95 million; Switch 2 hardware 23.68 million / software 58.17 million; "Mario Kart World" 5.63 million at June 30, 2025 and 15.39 million at June 30, 2026; the footnotes that software units include copies bundled with hardware and that Switch 2 Edition downloads count under Switch — as compiled and tabulated in full at Rec0deD88, "Console Game Attach Rate Statistics 2026," which reproduces the Nintendo IR tables with their sourcing. https://rec0ded88.com/statistics/console-game-attach-rate/ — opened in full. Ratios in the piece (65.0%, 96.7%, 9.97, 2.46) are the desk's divisions of these Nintendo units.
- Nintendo Co., Ltd., Financial Results Explanatory Material, Fiscal Year Ended March 2026 (May 8, 2026) — Switch 2 hardware 19.86 million and software 48.71 million for the fiscal year; "Mario Kart World" 14.70 million; the definition of sell-in (sales by the Nintendo group to outside entities, including direct sales to consumers); the note that bundled software is included in software units while its revenue is classified as hardware sales. https://www.nintendo.co.jp/ir/pdf/2026/260508_5e.pdf — opened in full.
- Sony Group Corporation quarterly earnings disclosures and Sony Interactive Entertainment, Business Data & Sales, as of June 30, 2026 — PS5 hardware 1.6 million in April–June 2026 (2.5 million a year earlier), cumulative sell-in passing 95 million; combined PS4-and-PS5 full-game software of 66.1 million units in April–June 2026 at an 82 percent digital share; no cumulative per-title sales published — as compiled in full at Rec0deD88, "Console Game Attach Rate Statistics 2026," Sony section, sourced there to SIE Business Data & Sales and Sony Group quarterly disclosures. https://rec0ded88.com/statistics/console-game-attach-rate/ — opened in full.

 Next in this issue · The ExplainersA Guinness World Record Isn't Official Until an Adjudicator Verifies It Against Written Rules. Here's How Entertainment Records Are Checked. →
THE MOTHER LODE — Edition Nº 005 · Evening. Photos are real, licensed and credited on the page; designed cards carry figures from the article itself.